Beetle trajectories
Question
How do beetles carrying nematodes move through the landscape during maturation feeding and egg laying? How far do they get, and how strongly are they drawn towards trees?
Setup
All parameters are set where the systems are created, in run.jl.
- Landscape: 1 km × 1 km, 10 m cells.
- Attraction: two
TreeAttractionfields (healthy and damaged trees),half_distance50 m,density_radius20 m,density_weight1. - Beetles: 100 beetles released in the center of the world at tick 0, from a damaged tree placed there (or an existing tree there made damaged).
- Mortality:
BeetleMortality, with life span drawn from an exponential distribution with a mean of 5 weeks, capped at a maximum age of 18 weeks (as inBeetleEmergence). The simulation runs for 18 weeks, until all beetles are dead. - Movement:
BeetleMovementwith 7 steps per week and up to 2 km per step, 3 weeks of maturation feeding (attracted by healthy trees), then each step feeding or egg laying (attracted by damaged trees) with probability 0.5.leave_tree_probability0.25.
To record every single movement step, the model runs with one movement step per tick, and phase durations scaled by 7. As trees and attraction fields are static here, this gives the same movement behaviour as weekly ticks.
Scenarios
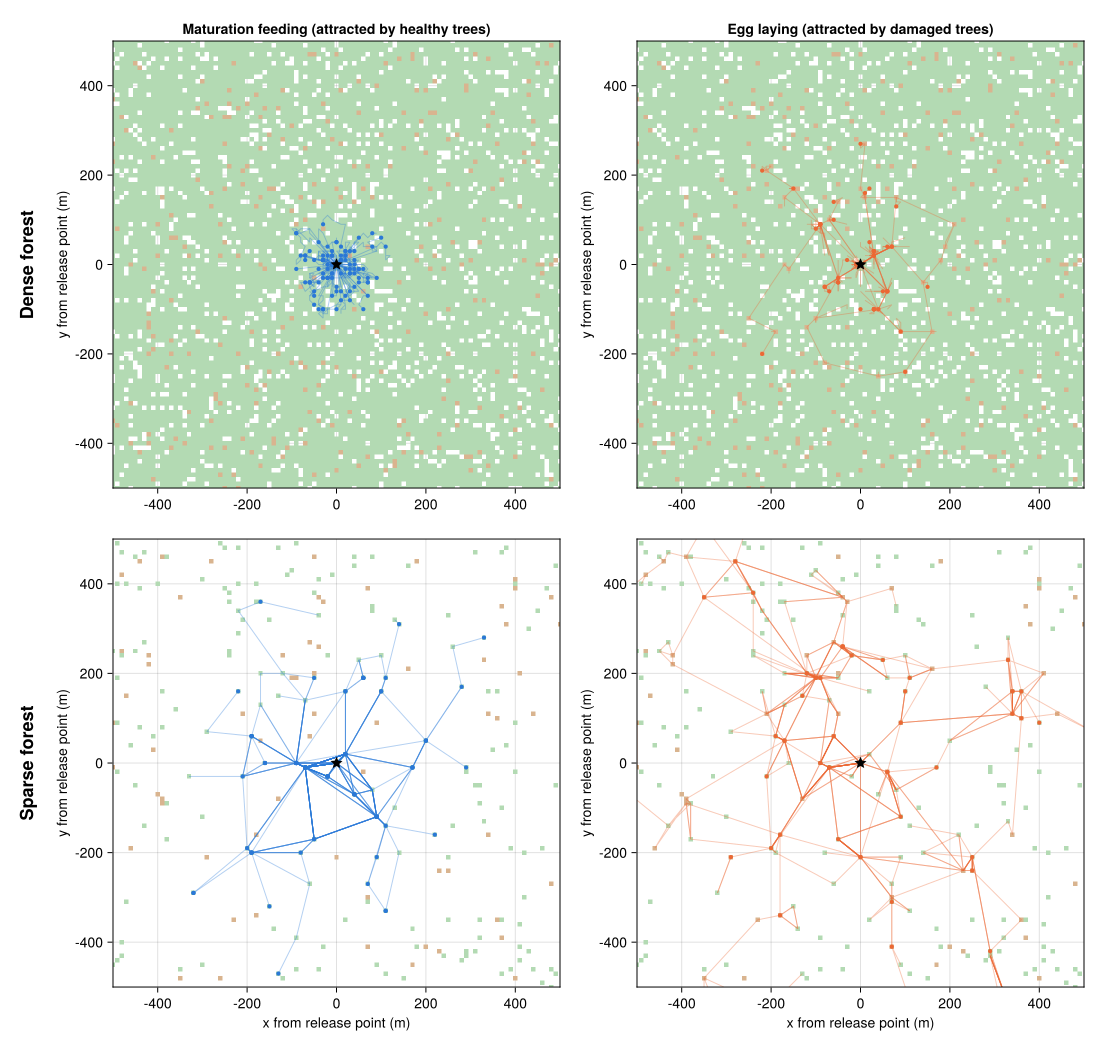
The experiment runs two scenarios that differ only in the tree landscape, created by InitTrees. Everything else is the same, including the random seed.
| Scenario | tree_probability | damage_prevalence |
|---|---|---|
| Dense forest | 0.9 | 0.03 |
| Sparse forest | 0.025 | 0.25 |
Running
From the PWNModel.jl/ directory:
julia --project=explore explore/beetle_trajectories/run.jlFigures are written to out/ as SVG (and PNG). They are not committed, but shown on the web page.
Figures
Trajectories by phase
Trajectories during maturation feeding (left) and egg laying (right), within 200 m of the release point, for both scenarios (rows). Green cells are healthy trees, brown cells damaged trees, the star is the release point, and colored dots are beetle positions at the end of the phase, or where they died during the phase.
Displacement
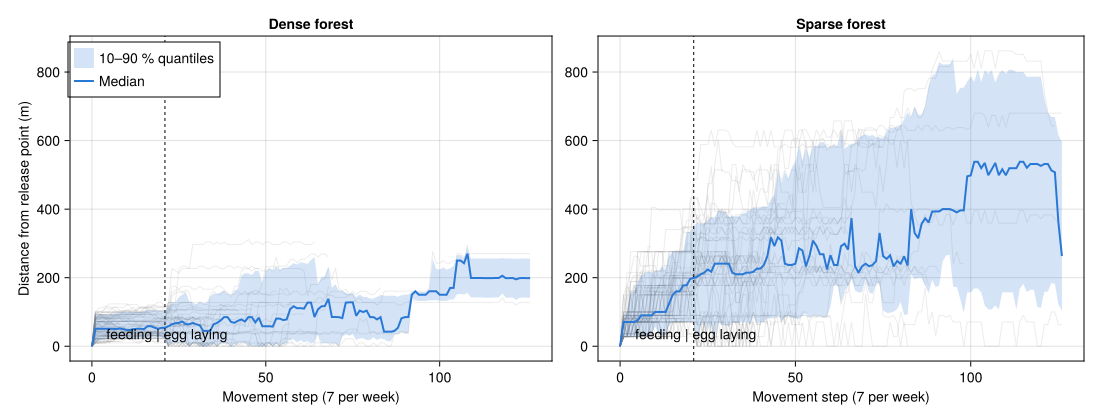
Distance of each beetle from the release point over movement steps (gray), with median and 10–90 % quantile band, for both scenarios.
Individual trajectories
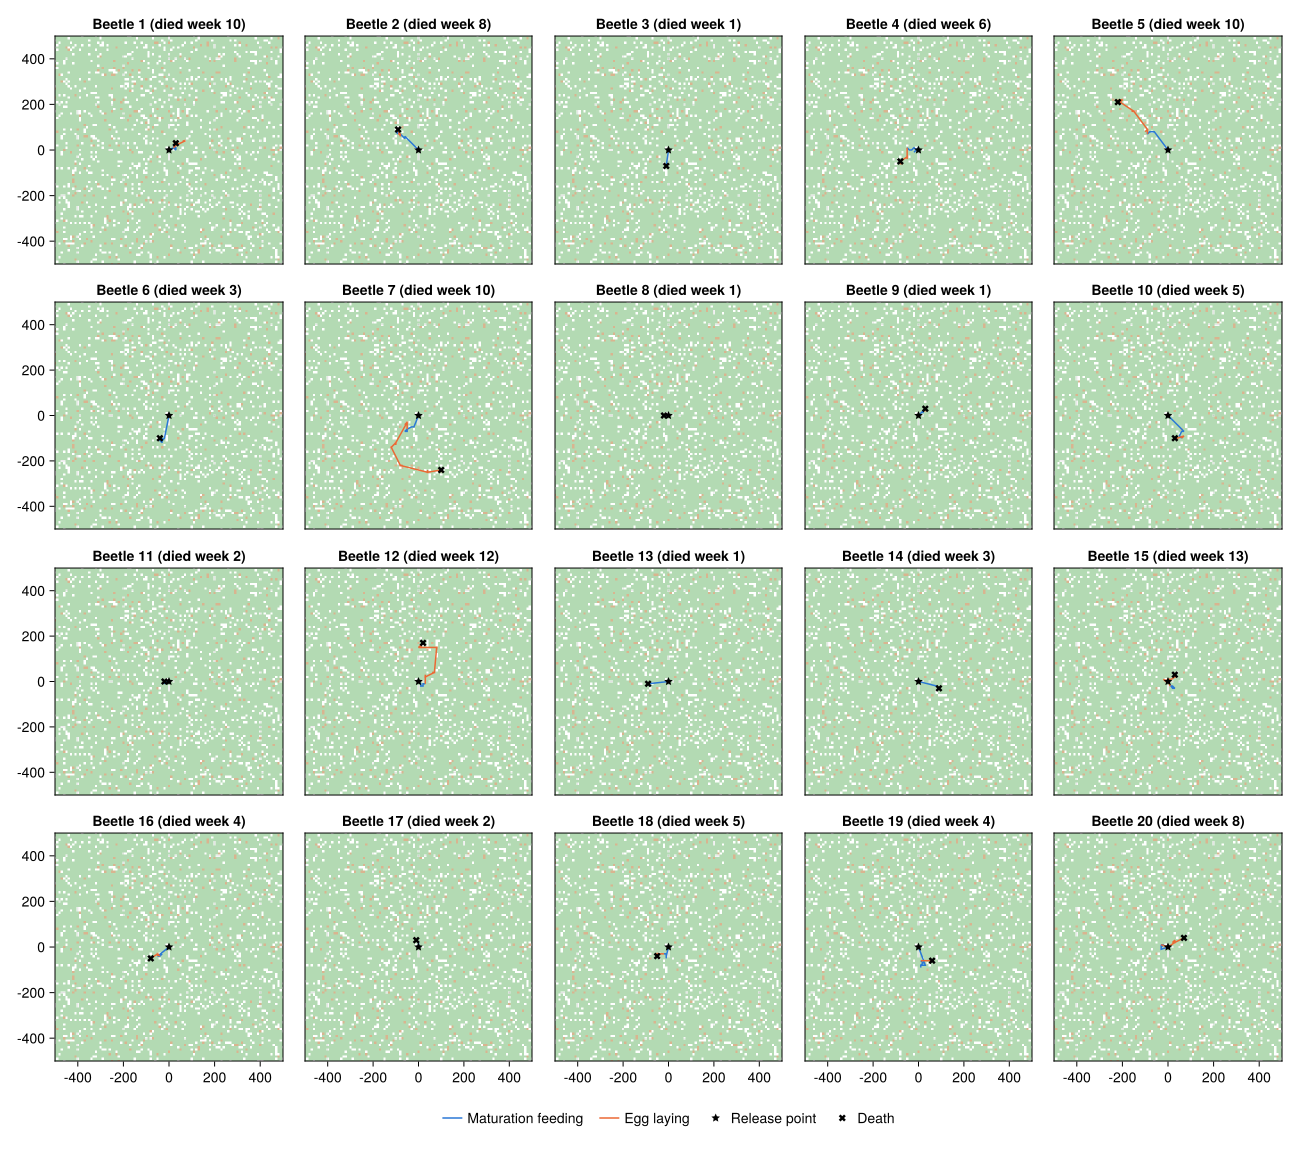
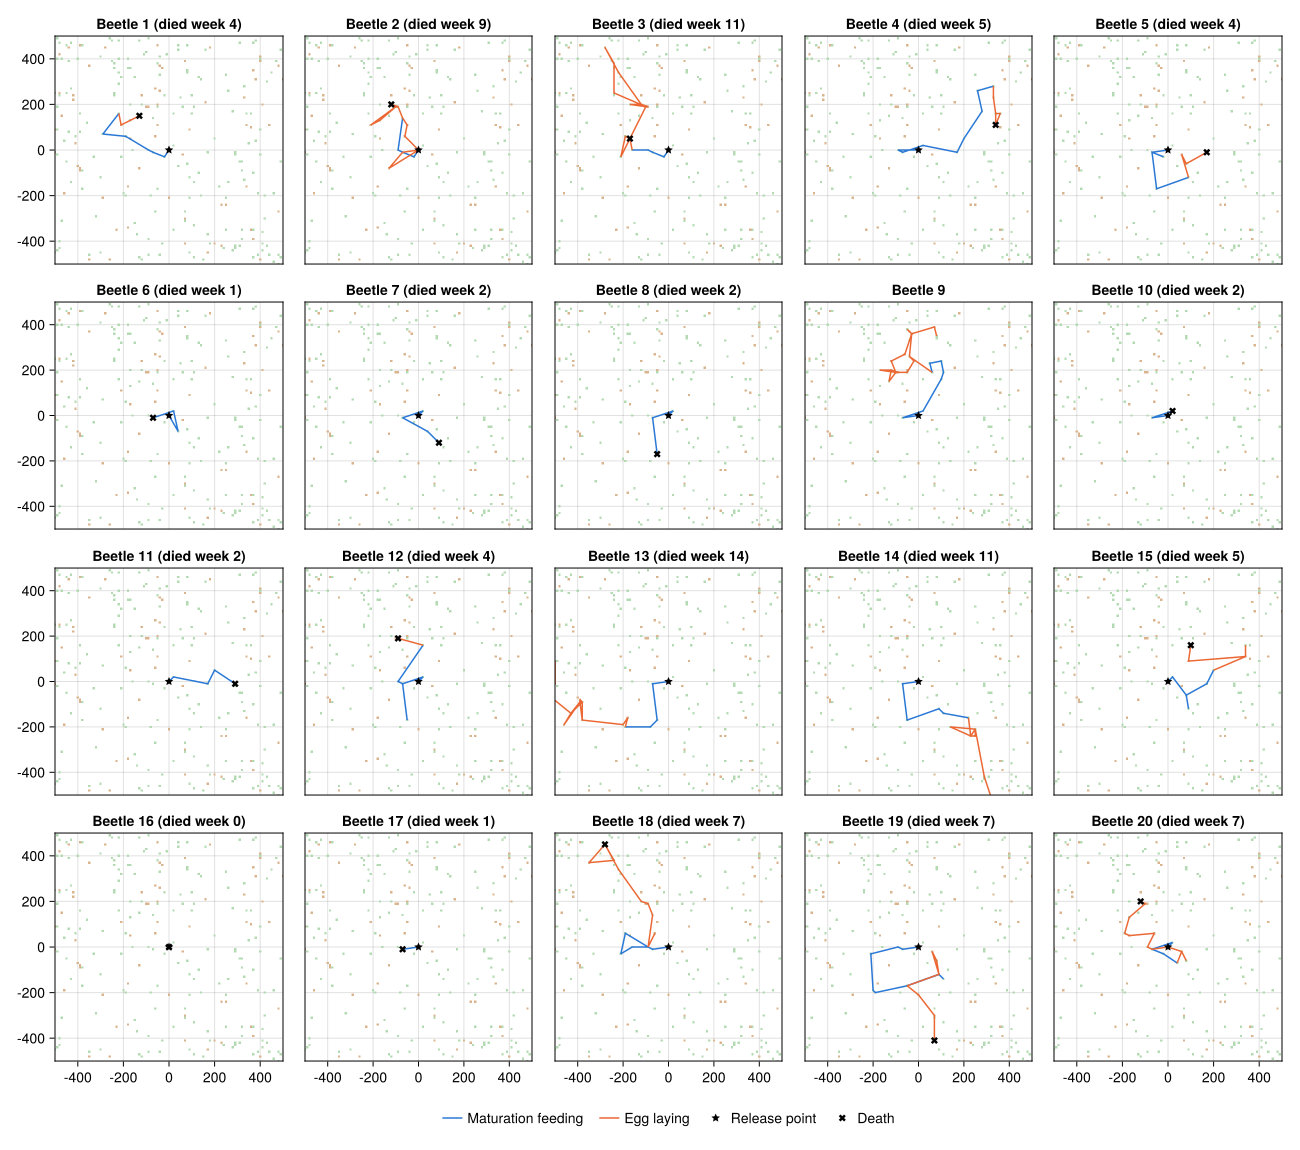
Trajectories of the first 20 beetles, one panel each, colored by phase (blue: maturation feeding, orange: egg laying). A cross marks where a beetle died, and the panel title gives the week of death.
Dense forest
Sparse forest
Observations
TODO